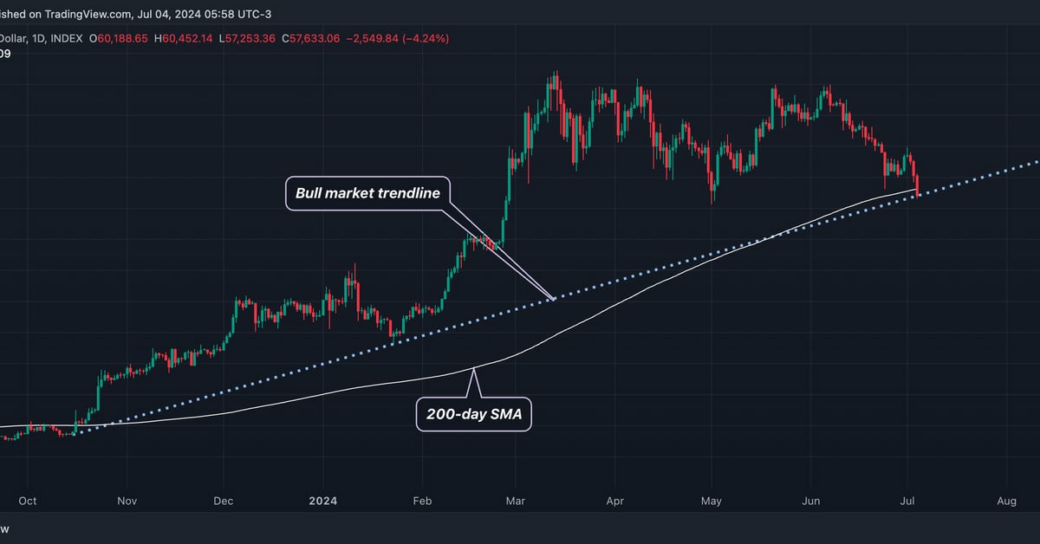
Bitcoin (BTC) experienced a significant decline recently, breaking below the 200-day simple moving average (SMA). The 200-day SMA is a key indicator of long-term trends in financial markets, including both traditional and crypto markets. This decline led to BTC dropping below $57,300, a level not seen since May 2nd, according to data from TradingView.
When an asset consistently trades below the 200-day SMA, it is often considered to be in a downtrend, while trading above it is seen as bullish. Bitcoin had surged above the 200-day SMA back in October when the average value was $28,000. This breakout was driven by anticipation surrounding a potential spot bitcoin ETF in the U.S., leading to a rapid rally that saw BTC reach record highs above $70,000 by March.
During the recent decline, BTC breached the bull market trendline support at $57,590, raising concerns among traders. A close below this level could trigger further selling pressure, as market participants often use trendline breakdowns as signals for making trading decisions. Analysts, such as Alex Kuptsikevich, senior market analyst at FxPro, suggest that prices may decline further to around $51,500 in the short term.
Kuptsikevich highlighted the significance of the recent drop below the 200-day SMA, indicating a potential bearish scenario. He mentioned that a 12% drop to $51.5k, which corresponds to the February consolidation area, is currently more probable than a similar percentage increase to $65.8k, aligned with the 50-day moving average.
Overall, the recent price action in Bitcoin has raised concerns among investors and traders, with many closely monitoring key support levels and technical indicators to gauge the future direction of the market. The crypto community awaits further developments to see if BTC can regain bullish momentum or if further downside movement is to be expected.