Understanding Bitcoin’s Bollinger Bandwidth and Market Volatility
Traders who have grown weary of Bitcoin (BTC)’s recent range-bound trading may find renewed interest as a significant indicator, known as the Bollinger bandwidth, has once again flashed a noteworthy signal. This indicator, which has previously demonstrated its ability to predict spikes in volatility, is illuminating the current market conditions, suggesting that a significant price movement could be imminent.
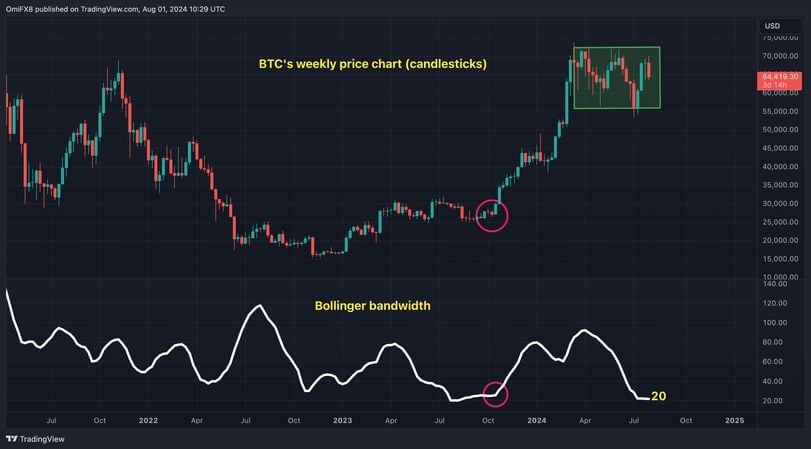
Bollinger bands, developed by John Bollinger in the 1980s, are volatility indicators that consist of three lines: the middle line is the 20-day (or weekly) simple moving average (SMA) of an asset’s price, while the upper and lower bands are placed two standard deviations away from this SMA. The bandwidth is calculated by taking the difference between the upper and lower bands and dividing it by the 20-period SMA. This results in an unbound oscillator that provides insight into market volatility.
Currently, Bitcoin’s Bollinger bandwidth has decreased to 20% on the weekly chart. This level was last observed just before Bitcoin broke out from its multi-month trading range of $25,000 to $32,000 in late October 2023. Following that breakout, Bitcoin prices surged past the $40,000 mark by the end of the year and reached record highs above $70,000 in March 2024.
The latest reading of 20% comes after a prolonged period of trading between $60,000 and $70,000, with only brief dips to around $55,000. This stability in price has led to increased speculation among traders regarding the potential for a breakout in either direction. Historical data indicates that similar bandwidth readings preceded significant volatility explosions in prior years, including November 2018, October 2016, mid-2015, and mid-2012, as discussed by CoinDesk in their analysis.
The concept of volatility is often described as being mean-reverting, meaning that periods of low volatility tend to be followed by periods of high volatility, and vice versa. A narrower bandwidth indicates price stability and is often seen as a precursor to a breakout, either upwards or downwards. Conversely, a high bandwidth signifies a period of increased volatility, suggesting that the market may be cooling down.
- Historical Context: Each of the previously mentioned periods of increased volatility led to significant price movements in the Bitcoin market. For example:
- In late 2018, Bitcoin saw a sharp decline following a period of high volatility.
- In mid-2015, after a similar bandwidth reading, Bitcoin experienced a dramatic price increase.
- In mid-2012, Bitcoin began its ascent to the then-record highs after a period of low volatility.
As traders monitor Bitcoin’s Bollinger bandwidth, they are reminded of the cyclical nature of market behavior. A decrease in bandwidth often signifies that the market is consolidating, leading to heightened anticipation of a breakout. This anticipation can lead to increased trading volumes as market participants position themselves for potential price movements.
In conclusion, Bitcoin’s current Bollinger bandwidth reading of 20% suggests that the market may be on the verge of a significant price movement. Traders should remain vigilant, as the historical patterns associated with Bollinger bandwidth indicate that the coming weeks could see increased volatility and potential trading opportunities. Understanding these indicators and their implications can better equip traders to navigate the complexities of the cryptocurrency market.