U.S. Economic Indicators: A Closer Look at the Leading Economic Index
The latest data from the Conference Board reveals a significant trend in the U.S. economy, suggesting a slowdown without the immediate threat of recession. The Leading Economic Index (LEI), which is a composite of various economic indicators, declined by 0.6% in July, bringing the index down to 100.4. This follows a modest decrease of 0.2% in June, indicating a continued downward trajectory from its peak in the second quarter of 2022. This trend is critical for investors and analysts who rely on these indicators to gauge the economic landscape.
The LEI includes several key components that provide insights into future economic conditions. These components encompass:
- Average weekly hours in manufacturing
- Average weekly initial claims for jobless insurance
- ISM new orders index
- Stock prices
- Leading credit index
These indicators are instrumental in predicting shifts in economic trends and potential turning points in financial markets. Economists often consider the LEI to be one of the most reliable predictors of recessions, which are technically defined as two consecutive quarters of negative growth.
Despite the continued decline in the LEI, the annualized six-month change improved, narrowing from -3.1% in June to -2.1% in July. This change suggests that the immediate risk of recession might be lessening, providing some reassurance to investors. Justyna Zabinska-La Monica, a senior manager at the Conference Board, stated, “The LEI continues to fall on a month-over-month basis, but the six-month annual growth rate no longer signals recession ahead.” This statement is crucial as it indicates a potential stabilization in the economy, which could bolster confidence among risk asset investors.
In recent weeks, markets have experienced heightened volatility, particularly after the release of U.S. nonfarm payroll data, which indicated a sharp slowdown in job creation during July. This data raised concerns among investors, leading to an initial panic that gripped the market. The Treasury yield curve showed signs of bull steepening—a phenomenon often viewed as a precursor to economic downturns—while Sahm’s Rule also pointed towards recessionary pressures. Additionally, the unwinding of yen carry trades exacerbated the situation, further contributing to market instability.
The impact of these developments was stark; stock prices plummeted, and Bitcoin, the leading cryptocurrency, saw its price drop from $70,000 to $50,000. However, in a surprising turn of events, Bitcoin has rebounded to over $60,000 as of the latest data from CoinDesk. This recovery may indicate a shift in market sentiment, suggesting that investors are beginning to view the recent downturn as an opportunity rather than a signal of impending doom.
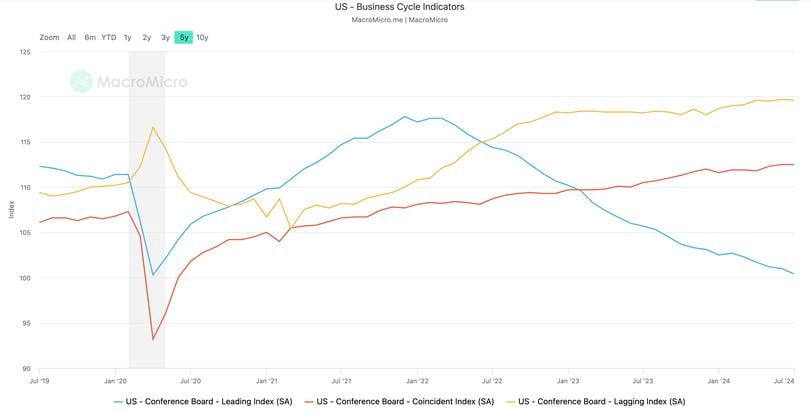
It is also essential to consider the broader economic context. While the LEI is trending downward, coincident indicators—those that reflect the current state of the economy—are on the rise. This divergence between leading and coincident indicators may signify that while we are in a late-stage expansion phase, the economy is not yet ready to contract. The simultaneous increase in lagging indicators further supports this viewpoint, as they typically reflect the health of the economy after changes have occurred.
Ultimately, while the LEI continues to signal caution, the improving six-month annual growth rate and the resilience of coincident indicators suggest that the economy may be navigating through a challenging period without slipping into recession. Investors in risk assets, including stocks and cryptocurrencies, may find solace in these developments, as they indicate a potential for recovery and growth in the coming months.
As we move forward, monitoring these indicators will be crucial for understanding the trajectory of the U.S. economy and making informed investment decisions. The evolving landscape requires vigilance and adaptability from investors as they respond to the changing economic signals.