Bitcoin’s Impressive Surge and Upcoming Challenges
Since November 2022, Bitcoin (BTC) has experienced a remarkable price surge, climbing nearly 300% from its lows of around $15,470. This significant increase has captured the attention of investors and analysts alike, highlighting Bitcoin’s potential as a valuable asset in today’s financial landscape. However, this uptrend is now facing potential challenges, particularly due to a technical indicator known as the “stochastics overbought downturn,” which has raised concerns about the sustainability of this rally.
The stochastic oscillator is a momentum indicator that traders and technical analysts commonly use to assess the strength of a security’s price movement. It compares a security’s current market price to its price range over a specified period, often 14 days, weeks, or months. The oscillator’s values range from 0 to 100, with readings above 80 signaling that an asset is potentially overbought. An overbought condition indicates that the price may be due for a correction, leading to a potential decline in value.
In the case of Bitcoin, the 14-month stochastic has recently crossed below the 80 mark, triggering the “overbought downturn” signal. This downturn indicates a weakening of the current uptrend and suggests that Bitcoin could experience price declines if the situation persists. Analysts from Fairlead Strategies have noted that if this trend continues through the end of the month, it could serve as a negative catalyst for Bitcoin’s price movement.
According to Fairlead Strategies, “The monthly chart of Bitcoin shows a pending overbought downturn in the monthly stochastics. If confirmed at month-end, it would be a negative catalyst, suggesting that the trading range marked the end of the cyclical uptrend from the 2022 low.” This statement reflects the cautious sentiment among analysts, as they monitor the market’s behavior closely.
Market Dynamics and Resistance Levels
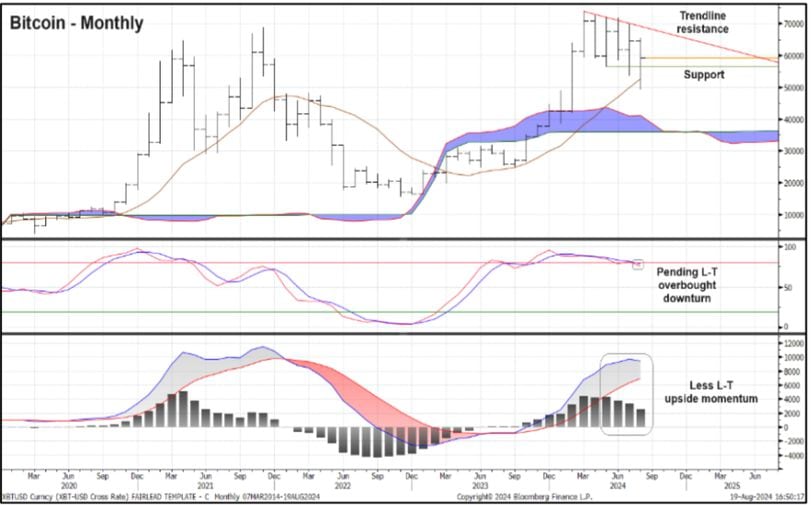
Despite the impressive surge since late 2022, Bitcoin’s uptrend has faced significant resistance since March. Bulls have struggled to establish a foothold above the critical psychological level of $70,000, as indicated by the trendline resistance visible on the monthly chart. This ongoing battle between buyers and sellers has created uncertainty in the market.
The challenges posed by the stochastic indicator are further compounded by additional technical signals. The MACD histogram, which is widely used to gauge trend strength and potential changes, has shown shallower bars. This indicates a weakening momentum, suggesting that the bullish trend may be losing steam. Moreover, the Ichimoku cloud, represented by the blue shaded area on the chart, has flattened out, signaling a “challenging environment going forward” according to Fairlead Strategies.
Investors should also consider the implications of these technical indicators. A flattening Ichimoku cloud typically suggests a period of consolidation or indecision in the market, where neither buyers nor sellers have a clear advantage. This can lead to increased volatility as traders react to news and market developments. The MACD histogram’s crossovers above and below the zero line signify potential bullish and bearish trend changes, and the height of the bars indicates the strength of these movements.
Current Market Status and Future Outlook
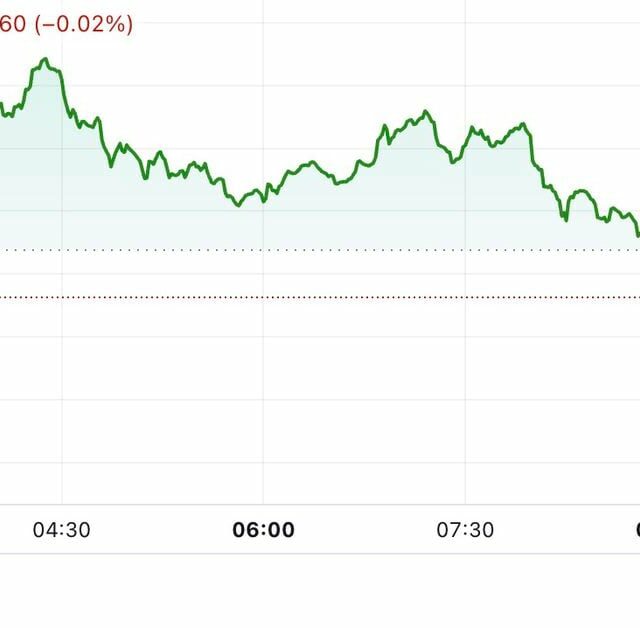
As of the latest data from CoinDesk, Bitcoin was trading at approximately $60,660. This price reflects a notable decrease from its peak levels earlier in the year, further emphasizing the importance of the resistance encountered at $70,000. The market sentiment appears cautious, with many traders and investors waiting to see how Bitcoin will respond to these technical signals in the coming weeks.
In summary, while Bitcoin has enjoyed a spectacular rise in value since late 2022, the current technical indicators suggest that traders should proceed with caution. The impending stochastic overbought downturn, combined with weakened momentum indicators like the MACD and Ichimoku cloud, signals a potential shift in the market dynamics. Investors should remain vigilant and consider both technical analysis and broader market trends as they navigate the evolving landscape of Bitcoin trading.