The Current State of Bitcoin: Analyzing the Market Trends
Bitcoin (BTC) has experienced a prolonged correction phase since reaching a peak price of $73,000 in March. This has led many investors to speculate that the market may have already seen its top price. However, a closer examination of recent price movements reveals similarities to Bitcoin’s behavior during previous market cycles. Historically, these cycles have culminated in significant price increases towards the end of the year, suggesting that a breakout to new all-time highs could be on the horizon in the coming months.
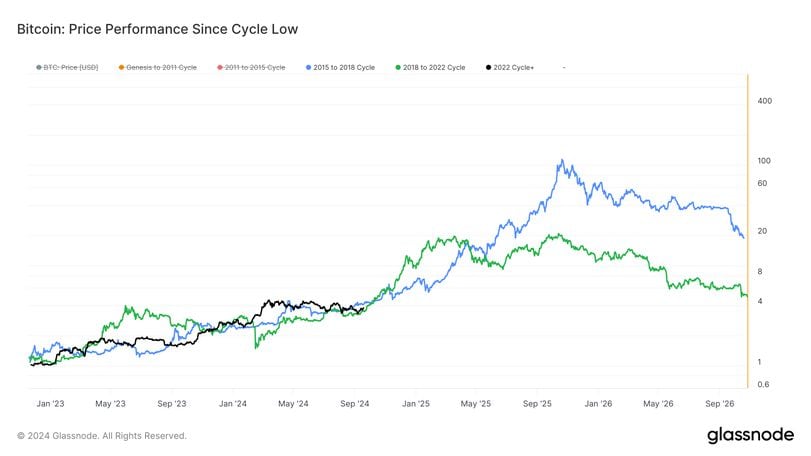
Despite the underwhelming performance of Bitcoin since March, it remains important to note that the cryptocurrency is still up approximately 290% from its market bottom in November 2022. This figure aligns closely with the gains observed during previous bull markets, as highlighted by data from Glassnode. Specifically, at this point in the four-year cycle, BTC saw increases of 309% during the 2015 to 2018 bull run and 251% during the 2018 to 2022 cycle.
Historical Patterns and Future Predictions
In both of these previous cycles, the steepest price rallies occurred later, as the market approached its peak. If Bitcoin continues to follow the patterns established in its earlier cycles, it could potentially experience a price increase of 600% to 900% from its cycle low by the end of the year. This could translate to a price range between $108,000 to $155,000.
Understanding the Halving Cycle
The current corrective phase also mirrors the price trends observed during Bitcoin’s previous halving years. A halving event occurs approximately every four years, reducing the issuance of new Bitcoins by 50%. This process is widely believed to create scarcity, subsequently impacting Bitcoin’s supply and potentially driving up its price.
Historical data shows that in the mid-cycles of 2016 and 2020, Bitcoin experienced significant price peaks followed by extended periods of sideways movement before breaking out again in the latter months of the year. Notably, BTC dipped more than 40% from its June 2016 intermediate cycle top before rallying to new highs in December. Similarly, in 2020, the price declined by about 21% following an August peak, only to eventually reach new highs by late October. These patterns indicate that the real momentum in Bitcoin’s price typically occurs in the following year after a halving event.
Current Trends and Market Sentiment
As of now, Bitcoin reached its local peak in March at $73,000 but experienced a decline of roughly 33% to its early August low. Crypto analyst CryptoCon has pointed out that we are approaching the end of the typical mid-cycle correction. He highlights that despite various predictions of a cycle top or a potential recession, the current cycle remains on track.
CryptoCon emphasizes the importance of not letting fear dictate market decisions, stating, “Whether it’s cycle top calls or recession predictions, everyone has a reason why they should fear the worst. Meanwhile, the cycle continues right on track, unscathed.” He adds that all indicators point towards a significant Bitcoin bull run expected in 2025.
Conclusion
In conclusion, while the current market may appear challenging, historical patterns and data suggest that Bitcoin could be on the verge of a major breakout. The cyclical nature of Bitcoin’s price movements, particularly in relation to halving events, indicates a strong potential for future growth. Investors should remain vigilant and informed, as the next few months could prove critical for Bitcoin’s trajectory.